

By Philip Hennessey, Director of Communications and Industry Analysis at Xeneta
Former British Prime Minister Harold Wilson once said, ‘a week is a long time in politics’, but for those people working in global supply chains it probably feels like an eternity right now.
Many businesses will feel like a kite in the breeze, helplessly being taken in whichever direction the geopolitical winds are blowing.
The escalating US-China trade war is threatening to shift global trade on its axis, meaning shippers must adapt their supply chain strategy to a new era of increased volatility and uncertainty.
This will not only be the case on major fronthaul trades from the Far East to the US and Europe, but also on intra-Asia trades.
More containers are shipped on intra-Asia ocean corridors than any other region on earth. In fact, for every seven boxes that leave the Far East bound for the US and Europe, another eight are shipped within Far East.
Clearly any disturbance to this delicately balanced trade ecosystem will have serious consequences.
If the geopolitical storm continues to rage, then the vast network of maritime trade routes will become even more difficult to navigate as shippers explore alternative supply chains and manufacturing set-ups.
The journey to overcome these challenges will be painful, but if shippers have the right data and market intelligence at their disposal – and are willing to adopt new approaches to supply chain setups and freight procurement – perhaps they may be all the stronger for it in the long term.
Singapore and Tanjung Pelepas – the Importance of Data
To demonstrate the importance of data and market intelligence, we can use the Xeneta platform to compare spot rate developments on two key intra-Asia trades – Shanghai to Singapore and Shanghai to Tanjung Pelepas, Malaysia.
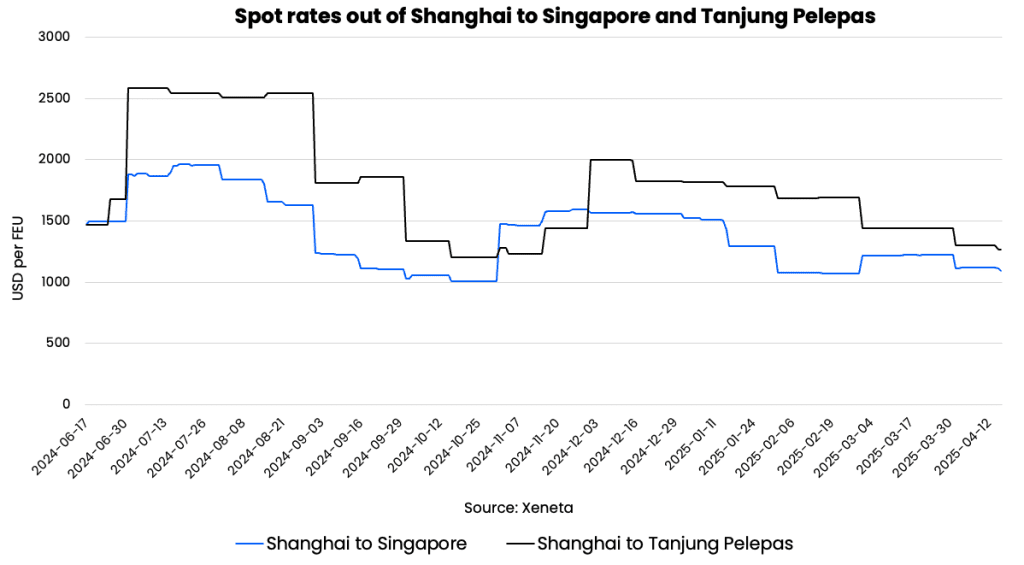
We start our journey on 17 June last year, when average spot rates on these two trades were exactly the same at USD 1471 per FEU (40ft container).
Given these are neighbouring ports, rates have historically tracked closely.
From that point on there has been significant volatility – not only in terms of freight rate spikes, but also the relationship between these two trades.
By 1 July, the spread in average spot rates between these trades had increased from zero to USD 707 per FEU.
On the trade from Shanghai to Tanjung Pelepas, average spot rates increased 76% in just 14 days to stand at 2,585 per FEU. On the trade from Shanghai to Singapore, spot rates increased by a lesser 28% in the same timeframe to reach USD 1878 per FEU.
What could have caused this spike in freight rates and distorted the relationship between these two trades?
The Red Sea crisis…
Ripple Effect of Red Sea Diversions
With the majority of container ships on trades between the Far East and Europe/US diverting around the Cape of Good Hope in Africa, one of the tactics carriers used to mitigate the impact of the longer sailing distance was increasing use of intra-regional transshipment services in Asia.
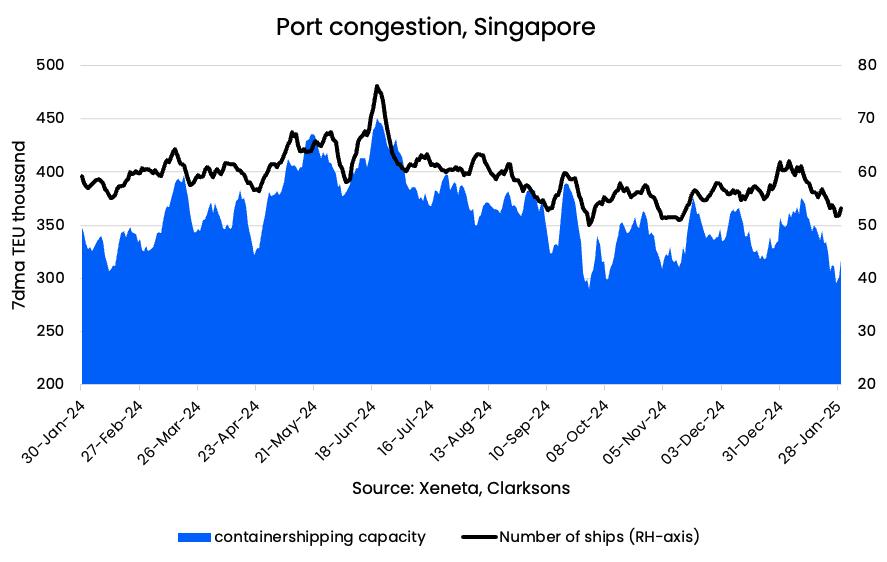
These good intentions had unintended consequences by causing massive port congestion, with Singapore – arguably the world’s most important transshipment hub – at the epicentre of this ocean supply chain storm.
The chart below shows port congestion in Singapore peaked on 20 June – at the same time freight rates from Shanghai were accelerating upwards.
This is where having data and market intelligence across intra-Asia trades is so important.
Avoiding Congestion Comes at a Cost
Carriers were urgently looking for ways to ease the congestion in Singapore, with the neighbouring port of Tanjung Pelepas an obvious alternative.
The close proximity of Tanjung Pelepas made sense for shippers too because they would avoid Singapore and still be able to maintain cargo flow.
However, if shippers wanted to take advantage of the carrier strategy of increasing use of Tanjung Pelepas, they would have to pay a premium for the privilege, so rates increased.
We are now seeing the spread in average spot rates narrow once again to USD 176 per FEU, perfectly demonstrating why it is so important to continuously monitor the freight rates offered on your existing trades as well as those you may turn to during times of crisis.
Long-term Scenario Planning in Wake of Tariff Threat
The US-China trade war will define 2025 and perhaps become a watershed moment for ocean freight procurement.
Shippers across the globe are now approaching freight procurement in a new way – and it is about more than rates.
The Xeneta platform calls upon more than 600 million crowdsourced datapoints, including long- and short-term freight rates, transit times, schedule reliability, capacity, detention and demurrage and surcharges.
All this data is required in a robust procurement strategy capable of meeting the challenges of the modern world.
For example, Xeneta customers are using data to carry out long-term strategy and scenario planning.
Many businesses responded to Trump’s tariffs during his first term in office by shifting manufacturing out of China and into countries such as India, Vietnam and Cambodia. Perhaps this massive investment has been diminished by the latest tariff announcement and there will be caution when repeating this approach.
That doesn’t mean you can’t use data to carry out simulations of alternative origins for sourcing, whether that is freight rates, container shipping capacity or benchmarking the carriers operating on those trades.
In addition, investors and shareholders are no doubt looking on and demanding to know what you are doing to protect the commercial interests of their business against these tariffs – so you better have a plan.
The Game of Tariff Compliance
Scenario planning could involve shipping goods from China to the US via another nation, such as Brazil.
Tariffs are a game of compliance, so that means getting creative in your supply chains.
Of course, the shipper needs to demonstrate the origin of the goods is Brazil not China, whether that is by repackaging or repurposing, but the key point is the scale of the tariffs incentivises shippers to get creative and play this compliance game.
Switching supply chains in this way is a complex undertaking and requires a breadth and depth of data a shipper may not need if they’re moving goods on tried and tested major trade lanes.
For example, which service provider to choose on your new trade lane?
Focusing on Brazil again, the below two charts show the spot rates the same carrier offers on the trade from Far East to South America Coast and Far East to US East Coast.
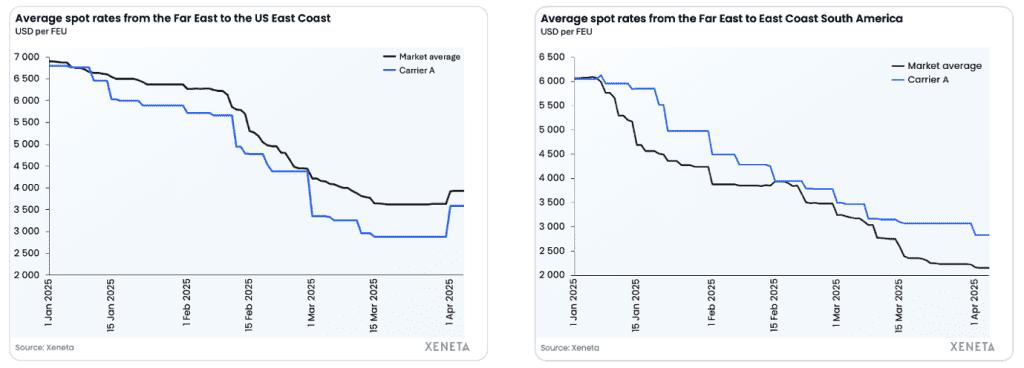
Carrier A offers below the market average into the US East Coast, but above the market average into Brazil (the carrier is anonymised for the purposes of this article, but Xeneta customers have access to this data within the platform).
If a shipper is looking at diversifying supply chains and doesn’t have access to this carrier benchmarking data, they may be left paying over the odds.
Port-level Data is Now a Necessity
It is now vitally important for shippers to have port-level data within the Far East region.
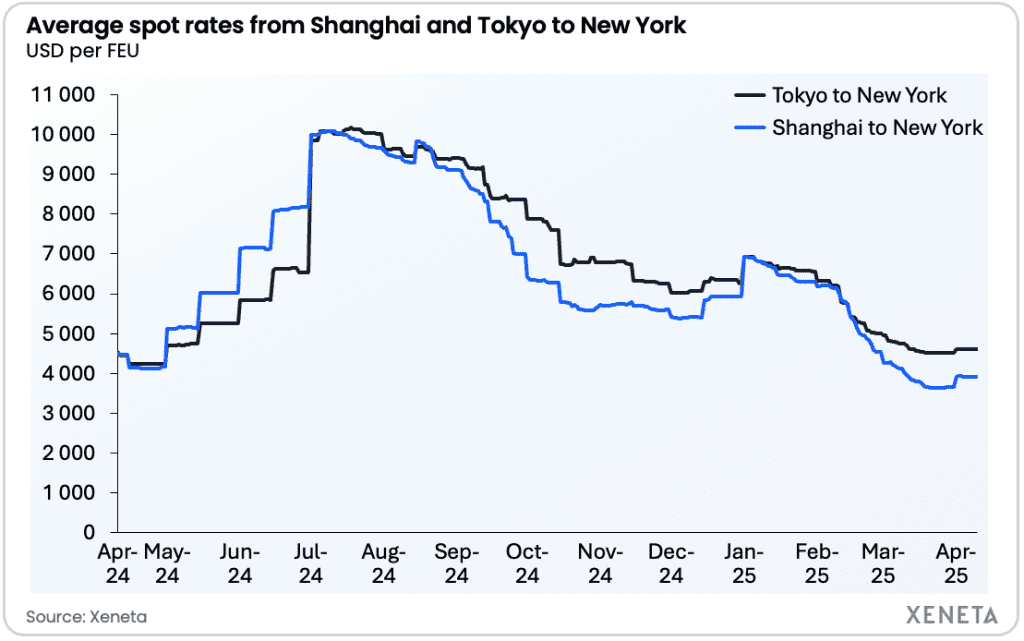
For example, a business shipping goods from Shanghai to New York may be considering switching the supply chain origin to Tokyo. If so, the below chart demonstrates the freight rate volatility between these two trades.
Right now, Shanghai is the cheaper of the two trades, but in the first half of 2024, Tokyo was the cheaper option.
If a shipper only has regional-level freight rate data from the Far East to the US East Coast, they have no way of monitoring the important market developments at a port level.
Transit times – risk and reward
Shifting supply chains comes with risk, and it is about much more than freight rates.
Understanding transit times is another vital ingredient in a diversification strategy.
For example, the chart below shows Xeneta transit time data into the US East Coast and US West Coast from both China and South Korea.
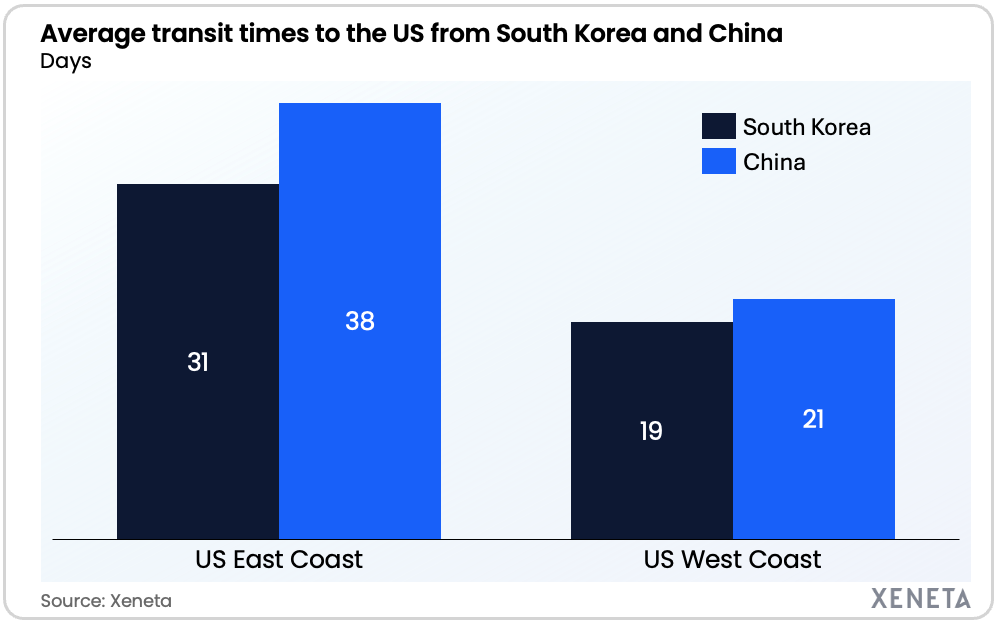
Importing into the US East Coast from South Korea rather than China would benefit from a shorter transit time by seven days. Into the US West Coast, the benefit is a lesser two days.
There are clear advantages to be gained from a shorter transit time, such as a faster time to market for your product.
However, there is also an inherent risk in not having this data. If a shipper chooses a new trade lane with a longer transit time and materials do not arrive at a manufacturing facility on time, or their goods are not on shelves, there are serious financial repercussions.
The World Has Changed – Your New Freight Strategy Starts Today
There is nothing anyone can do about Donald Trump’s next move in the US-China trade war or whether the Houthis cease their attacks in the Red Sea.
However, that doesn’t mean businesses can’t use data to work proactively and make sure they are ready to make the right decision at the right time to protect their supply chain and manage freight spend.
The world has changed and most agree that doing nothing isn’t an option.
The challenge is knowing what your freight procurement strategy needs to look like in future. And for that, data is your friend.
About the author

Philip Hennessey
Director of Communications and Industry Analysis · Xeneta